Market Outlook
March 06, 2018
Market Cues
Domestic Indices
Chg (%)
(Pts)
(Cl ose)
Indian markets are likely to open positive tracking global indices and SGX Nifty.
BSE Sensex
(0.9)
(300)
33,747
U.S. stocks showed a significant turnaround over the course of the trading session
Nifty
(1.0)
(99)
10,359
after an initial move to the downside. The Dow Jones rose 1.4% to end at 28,875.
Mid Cap
(1.0)
(157)
16,304
The NASDAQ gained 1.0% to close at 7,331.
Small Cap
(1.1)
(197)
17,888
U.K. stocks ended in the green snapping a four-session slide, as supermarket chains
Bankex
(0.4)
(119)
27,953
Tesco and Morrison’s advanced, and as last week’s selloff offered opportunities to
investors. The FTSE 100 is up by 0.7% to end at 7,116.
Global Indices
Chg (%)
(Pts)
(Cl ose)
On domestic front, Indian shares fell for a fourth straight session as weak global
Dow Jones
1.4
337
24,875
cues overshadowed the BJP's spectacular performance in recently-held elections in
Nasdaq
1.0
73
7,331
three North Eastern states. BSE Sensex is down by 0.9% to close at 33,747.
FTSE
0.7
46
7,116
News Analysis
Nikkei
2.1
445
21,487
SC directs Unitech to file detailed affidavit of assets in India and abroad
Hang Seng
1.1
333
30,219
Detailed analysis on Pg2
Shanghai Com
(0.4)
(12)
3,245
Investor’s Ready Reckoner
A dvances / Declines
BSE
NSE
Key Domestic & Global Indicators
Advances
723
404
Stock Watch: Latest investment recommendations on 150+ stocks
Declines
2,069
1,415
Refer Pg5 onwards
Unchanged
143
55
Top Picks
C MP
Target
U psi de
Volumes (` Cr)
C ompany
Sector
R ating
(`)
(`)
(%)
BSE
4,036
Blue Star
Capital Goods Accumulate
790
867
9.7
Dewan Housi ng Finance
Financials
Buy
532
720
35.3
NSE
27,985
Century Plyboards
Forest Products
Buy
329
400
21.8
Navkar Corporation
Other
Buy
169
265
56.5
Net Inflows (` Cr)
Ne t
Mtd
Ytd
KEI Industrie s
Capital Goods
Buy
379
436
15.0
FII
424
424
916
More Top Picks on Pg4
*MFs
1,673
13,261
22,284
Key Upcoming Events
Previous
C onsensus
D ate
Region
Event Description
Top Gainers
Price (`)
Chg (%)
Reading
Expectations
Mar07
Euro Zone Euro-Zone GDP s.a. (QoQ)
0.60
0.60
BEML
1,362
10.5
Mar08
China
Exports YoY%
11.10
11.00
MINDTREE
860
6.0
Mar08
US
Initial Jobless claims
210.00
220.00
IDBI
84
5.1
Mar08
Euro Zone ECB announces interest rates
-
-
VAKRANGEE
163
5.0
Mar09
US
Change in N onfarm payrolls
200.00
205.00
More Events on Pg7
BLUESTARCO
785
3.8
Top Losers
Price (`)
Chg (%)
BALRAMCHIN
107
(8.6)
INOXWIND
127
(6.2)
NMDC
123
(5.9)
DEEPAKFERT
317
(5.5)
JMFINANCIL
137
(5.4)
As on March 05 2018
Market Outlook
March 06, 2018
News Analysis
SC directs Unitech to file detailed affidavit of assets in India and
abroad
The Supreme Court directed real estate investment firm Unitech Ltd to file a
detailed affidavit of their assets both in India and abroad. The decision follows an
order from the top court in December, staying the National Company Law
Tribunal (NCLT) order which barred Unitech directors from acting as co-directors
of the company over alleged mismanagement of funds.
Prior to that, the apex court had ordered Unitech to deposit an amount of Rs 7.5
billion before the court. On a related note, Unitech owes Rs 7.23 billion to 51,000
fixed deposit holders, and the company and its subsidiaries are yet to deliver
19,000 flats to buyers.
Economic and Political News
Government tax hike to cut palm oil imports, boost soyoil, sunflower oil
buying
Odisha to get tough with illegal miners who defaulted on penalty payments
According to Crisil, Global growth, domestic demand to lift FY19 GDP to
7.5%
Corporate News
Tata Motors launches special edition of Zest Premio at Rs 753,000
Nexus Venture Partners invests $1.1 million in SaaS platform LivHealth
RInfra serves notice to Pipapav Defence promoters for Rs 54.40bn claims
Infosys grants nearly 2mn stock units to Salil Parekh and other key officials
SC directs Unitech to file detailed affidavit of assets in India, abroad
Market Outlook
March 06, 2018
Top Picks
Market Cap
C MP
Target
Upside
C ompany
R ationale
(` Cr)
(`
(`)
(%)
Strong growth in domestic business due to its leade`hip
in acute therapeutic se gment. Alkem expects to launch
Alkem Laboratories
26,603
2,225
2,441
9.7
more products in USA, w hich bode s for its i nternational
busine ss.
Favorable outlook for the AC industry to augur well for
Cooling products busi ness which is out pacing the
Blue Star
7,585
790
867
9.7
market growth. EMPPAC division' s profitability to
improve once operating environment turns around.
With a focus on the low and me dium income (LMI)
consumer segment, the company has increased its
Dewan Housi ng Finance
16,690
532
720
35.3
presence in tier-II & III cities where the growth
opportunity i s immense.
Loan growth is likely to pick up after a sluggish FY17.
Lower credit cost will help in strong bottom-line growth.
Karur Vysya Bank
7,723
106
160
50.5
Increasing share of CASA will help in NIM
improve ment.
High order book execution in EPC segment, rising B2C
KEI Industrie s
2,971
379
436
15.0
sales and higher exports to boost the revenues and
profitability
Expected to benefit from the lower capex requirement
Music Broadcast
2,263
397
475
19.8
and 15 ye ar long radio broadcast licensing.
Massive capacity expansion al ong with rail advantage
Navkar Corporation
2,549
169
265
56.5
at ICD as well CFS augur well for the company
Strong brands and distribution network would boost
Siyaram Silk Mills
3,066
654
851
30.1
growth going ahe ad. Stock currently trades at an
inexpensive valuation.
Market leadership in Hindi news genre and no.
2
viewership ranking in English news genre, exit from the
TV Today Network
2,690
451
508
12.6
radio busine ss, and anticipated growth in ad spends by
corporate to benefit the stock.
After GST, the company is expected to see higher
volume s al ong with i mproving product mix. The Gujarat
Maruti Suzuki
2,65,814
8,799
10,619
20.7
plant will also enable higher operating leverage which
will be margin accretive.
We expect loan book to grow at 24.3% over next two
GIC Housing
2,112
392
655
67.0
year; change in borrowing mix will help in NIM
improve ment
We expect CPIL to re port net Revenue/PAT CAGR of
~17%/ 16% over FY2017-20E mainly due to healthy
7,298
329
400
21.8
growth in plywood & lamination business, forayed into
Century Plyboards India
MDF & Particle boards on back of strong brand &
distribution network.
We expect sales/PAT to grow at 13.5%/20% over next
LT Foods
2,920
91
128
40.2
two years on the back of strong distribution network &
addition of new products in portfolio.
Third large st brand pl ay in luggage segment Incre ase d
product offerings and i mproving di stribution network i s
Safari Industries
1,198
538
650
20.8
leading to strong growth in business. Likely to post
robust growth for next 3-4 years
We expect HSIL to re port PAT CAGR of ~15% over
FY2017-20E owing to better improve ment in operating
HSIL
3,141
434
510
17.4
margin due price hike in container glass segment,
turnaround in consumer business.
We expect financialisati on of savings and increasing
Aditya Birla Capital
35841
162
230
41.9
penetration in Insurance & Mutual fund w ould e nsure
steady growth.
Source: Company, Angel Research
Market Outlook
March 06, 2018
Fundamental Call
Market Cap
C MP
Target
Upside
C ompany
R ationale
(` Cr)
(`)
(`)
(%)
CCL is likely to maintain the strong growth trajectory
CCL Products
3,964
298
360
20.8
over FY18-20 backed by capacity expansi on and new
geographical foray
We forecast Nilkamal to report top-line CAGR of ~9%
to `2,635cr over FY17-20E on the back of healthy
Nilkamal
2,516
1,686
2,178
29.2
demand growth in pl astic division. On the bottom -line
front, we estimate ~10% CAGR to `162cr owing to
improve ment in volumes.
We expect sales/PAT to grow at 9%/ 14% over next two
years on the back of healthy demand growth in
Shreyans Industries
208
150
247
64.4
printing. Further, China had banned maki ng paper
from waste pulp which would benefit Indian paper
companie s.
The prism has diversified exposure in the different
segment such as Cement, Tile & ready mix concrete.
Prism Cement
6,239
124
160
29.1
Thus we believe, PCL is in the right place to capture
ongoing government spendi ng on affordable housing
and infrastructure projects.
Elantas Beck India is the Indian market leader in liquid
insulation segment use d in electrical equipments like
Elantas Beck India Ltd
1,586
2,001
2,500
25.0
motors, transformers etc. It derives demand from
several industries which are expected to register 10%+
CAGR in demand in the coming years.
RPL to report healthy top-line CAGR of ~13% over
FY17-20E on the back of healthy de mand in printing &
Ruchira Papers Ltd.
388
173
244
41.1
writing paper segments. On the bottom-line front, we
estimate ~16% CAGR over FY17-20E owing to strong
improve ment in operating performance.
Greenply Industries Ltd (GIL) manufactures plywood &
allied products and medium density fibreboards
(MDF). GIL to report net reve nue CAGR of ~14% to
Greenply Industries
4,122
336
395
17.5
~`2,478cr over F Y2017-20E mainly due to healthy
growth in plywood & lamination busine ss on the back
of strong brand and di stribution network
Source: Company, Angel Research
Market Outlook
March 06, 2018
Key Upcoming Events
Global economic events release calendar
Bl oomberg Data
D ate
Time
C ountry
Event Description
Unit
Period
L ast Reporte d
E stimate d
Mar 07, 2018
3:30 PM Euro Zone
Euro-Zone GDP s.a. (QoQ)
% Change
4Q F
0.60
0.60
Mar 08, 2018
China
Exports YoY%
% Change
Feb
11.10
11.00
7:00 PM US
Initial Jobless claims
Thousands
Mar 3
210.00
220.00
6:15 PM Euro Zone
ECB announces interest rates
%
Mar 8
-
-
Mar 09, 2018
7:00 PM US
Change in N onfarm payrolls
Thousands
Feb
200.00
205.00
3:00 PM UK
Industrial Production (YoY)
% Change
Jan
-
1.90
7:00 AM China
Consumer Price Index (YoY)
% Change
Feb
1.50
2.50
7:00 PM US
Unnemployment rate
%
Feb
4.10
4.00
Mar 12, 2018
5:30 PM India
Industrial Production YoY
% Change
Jan
7.10
Mar 13, 2018
6:00 PM US
Consumer price index (mom)
% Change
Feb
0.50
0.10
Mar 14, 2018
12: 00 PM India
Monthly Wholesale Prices YoY%
% Change
Feb
2.84
US
Producer Price Index (mom)
% Change
Feb
0.70
Mar 15, 2018
India
Imports YoY%
% Change
Feb
26.10
India
Exports YoY%
% Change
Feb
9.10
Mar 16, 2018
3:30 PM Euro Zone
Euro-Zone CPI (YoY)
%
Feb F
1.20
6:45 PM US
Industrial Production
%
Feb
(0.05)
0.30
6:00 PM US
Building permits
Thousands
Feb
1,377.00
1,310.00
6:00 PM US
Housi ng Starts
Thousands
Feb
1,326.00
1,278.00
Mar 20, 2018
8:30 PM Euro Zone
Euro-Zone Consumer Confidence
Value
Mar A
0.10
3:00 PM UK
CPI (YoY)
% Change
Feb
3.00
Mar 21, 2018
7:30 PM US
Existing home sales
Million
Feb
5.38
3:00 PM UK
Joble ss claims change
% Change
Feb
(7.20)
11: 30 PM US
FOMC rate decision
%
Mar 21
1.50
1.75
Mar 22, 2018
2:00 PM Germany
PMI Manufacturing
Value
Mar P
60.60
Source: Bloomberg, Angel Research
Market Outlook
March 06, 2018
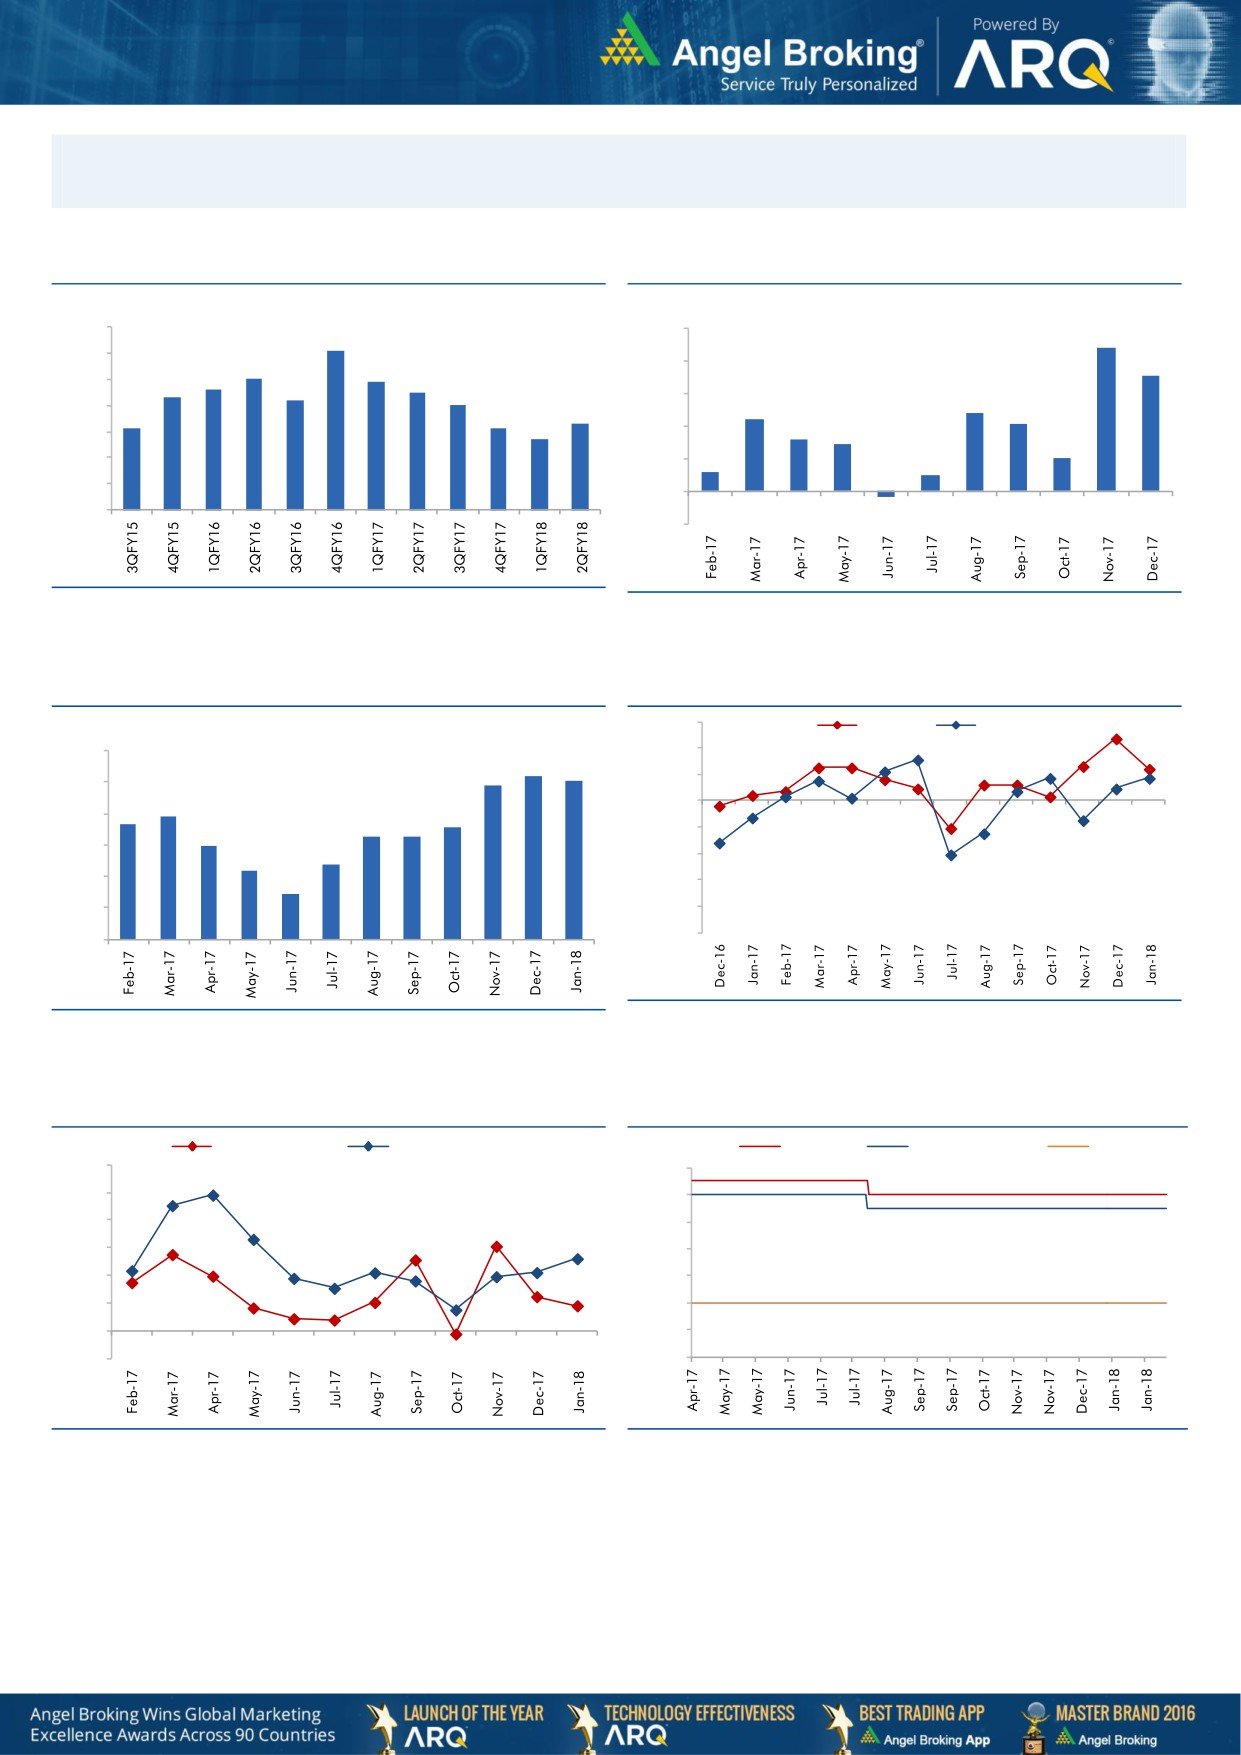
Macro watch
Exhibit 1: Quarterly GDP trends
Exhibit 2: IIP trends
(%)
(%)
10.0
10.0
9.1
8.8
9.0
8.0
7.1
8.0
7.9
7.6
7.5
8.0
7.3
7.2
7.0
6.0
4.8
7.0
6.3
4.4
4.1
6.1
6.1
5.7
4.0
3.2
2.9
6.0
2.0
5.0
2.0
1.2
1.0
4.0
-
3.0
(0.3)
(2.0)
Source: CSO, Angel Research
Source: MOSPI, Angel Research
Exhibit 3: Monthly CPI inflation trends
Exhibit 4: Manufacturing and services PMI
56.0
Mfg. PMI
Services PMI
(%)
6.0
54.0
5.2
5.1
4.9
52.0
5.0
3.9
50.0
4.0
3.7
3.6
3.3
3.3
3.0
48.0
3.0
2.4
2.2
46.0
2.0
1.5
44.0
1.0
42.0
40.0
-
Source: Market, Angel Research; Note: Level above 50 indicates expansion
Source: MOSPI, Angel Research
Exhibit 5: Exports and imports growth trends
Exhibit 6: Key policy rates
(%)
Exports yoy growth
Imports yoy growth
(%)
Repo rate
Reverse Repo rate
CRR
60.0
6.50
50.0
6.00
40.0
5.50
30.0
5.00
20.0
4.50
10.0
4.00
0.0
3.50
(10.0)
3.00
Source: Bloomberg, Angel Research
Source: RBI, Angel Research
Market Outlook
March 06, 2018
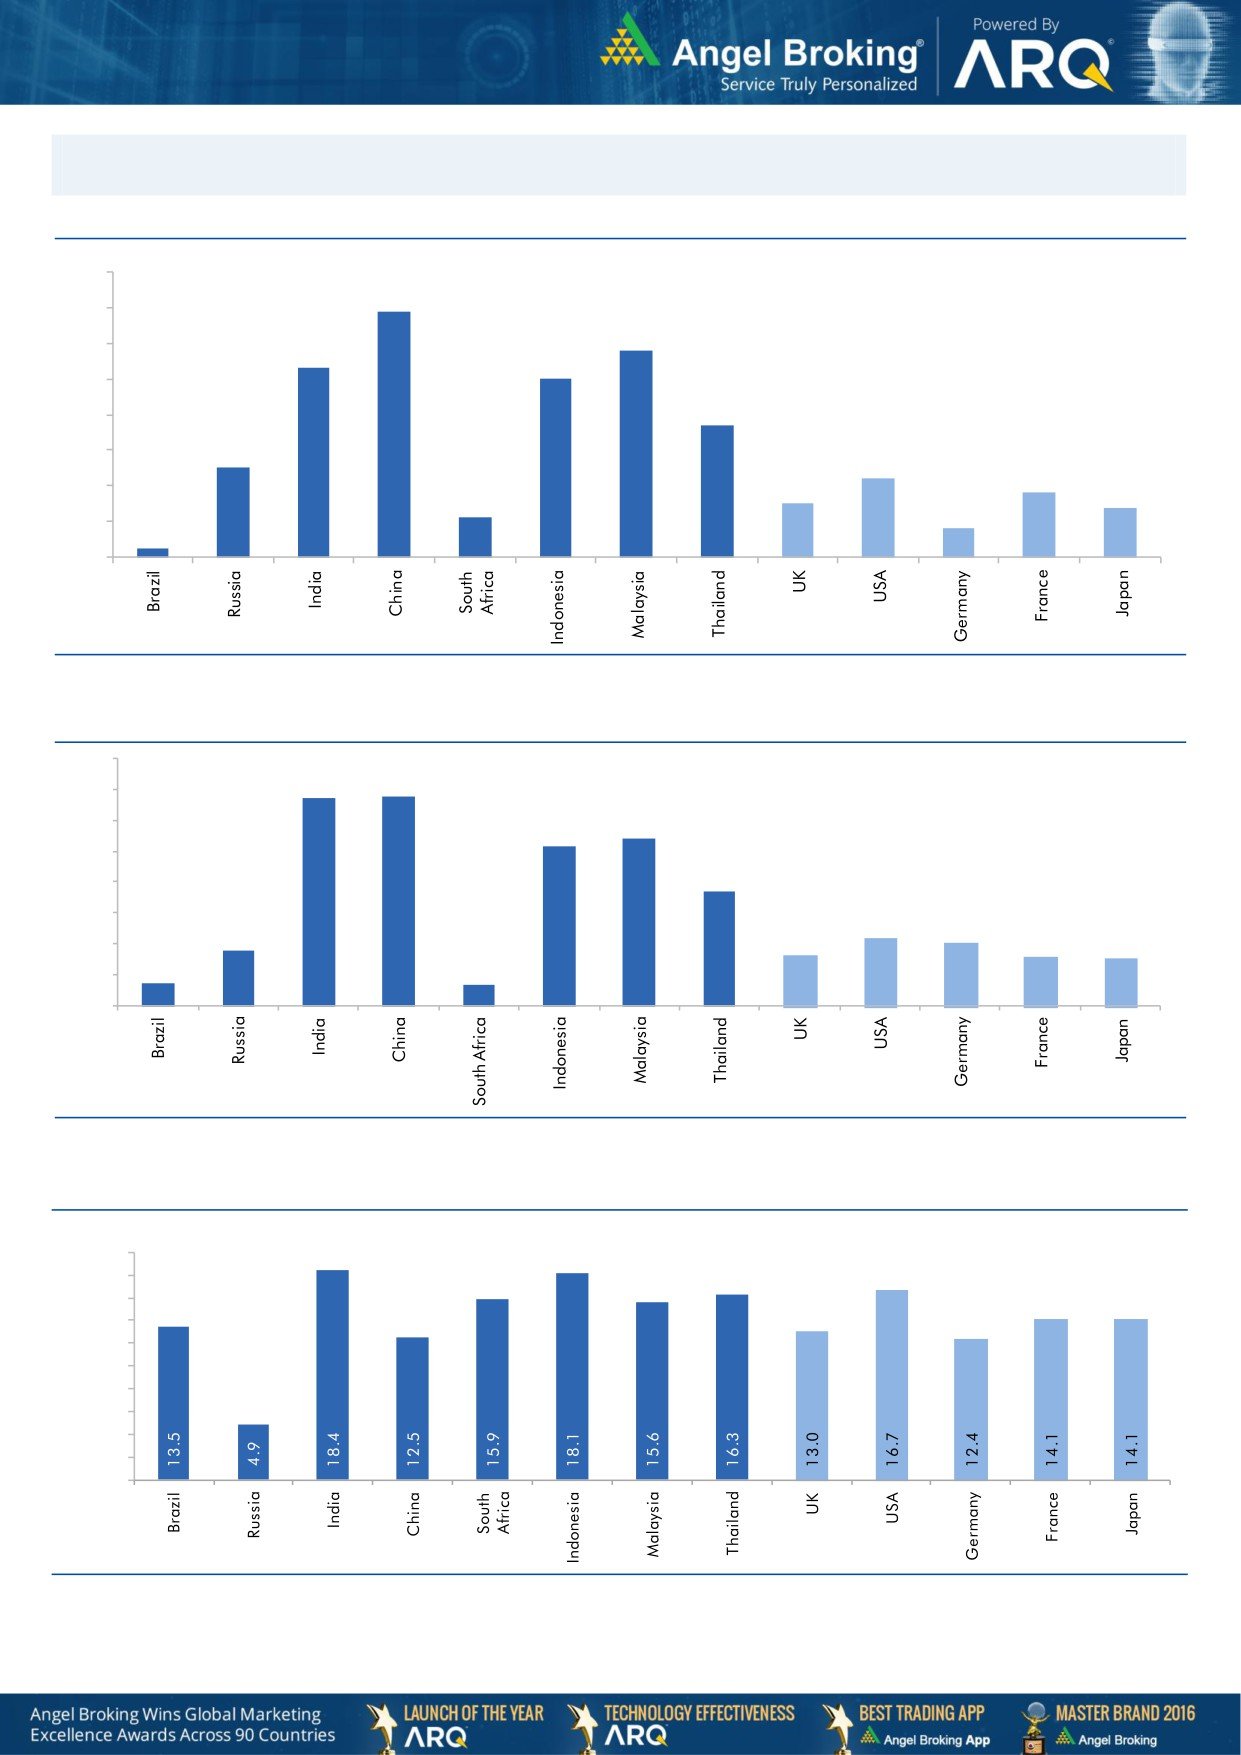
Global watch
Exhibit 1: Latest quarterly GDP Growth (%, yoy) across select developing and developed countries
(%)
8.0
6.9
7.0
5.8
6.0
5.3
5.0
5.0
1.1
3.7
4.0
2.5
3.0
2.2
1.8
2.0
1.5
1.4
0.8
1.0
0.3
-
Source: Bloomberg, Angel Research
Exhibit 2: 2017 GDP Growth projection by IMF (%, yoy) across select developing and developed countries
(%)
6.7
6.8
7.0
6.0
5.4
5.2
5.0
3.7
4.0
3.0
1.8
2.2
2.0
1.7
1.6
2.0
0.7
1.5
0.7
1.0
-
Source: IMF, Angel Research
Exhibit 3: One year forward P-E ratio across select developing and developed countries
(x)
20.0
18.0
16.0
14.0
12.0
10.0
8.0
6.0
4.0
2.0
-
Source: IMF, Angel Research
Market Outlook
March 06, 2018
Exhibit 4: Relative performance of indices across globe
Returns (%)
C ountry
Name of index
Closing price
1M
3M
1YR
Brazil
Bovespa
86,023
1.8
16.2
25.4
Russia
Micex
2,310
0.9
8.7
12.3
India
Nifty
10,359
(6.3)
(0.0)
16.7
China
Shanghai Composite
3,257
(8.8)
(2.6)
(0.2)
South Africa
Top 40
51,022
(2.7)
(4.2)
13.8
Mexico
Mexbol
47,721
(5.4)
0.2
0.6
Indonesia
LQ45
1,090
(1.3)
7.0
22.0
Malaysia
KLCI
1,843
(1.5)
7.1
8.1
Thailand
SET 50
1,190
0.3
9.0
21.1
USA
Dow Jones
24,875
(4.9)
3.9
18.7
UK
FTSE
7,116
(5.0)
(2.9)
(3.0)
Japan
Nikkei
21,042
(8.9)
(6.4)
9.1
Germany
DAX
12,091
(7.0)
(7.2)
1.1
France
CAC
5,167
(5.3)
(3.8)
3.7
Source: Bloomberg, Angel Research p68in4
Market Outlook
March 06, 2018
Research Team Tel: 022 - 39357800
DISCLAIMER
Angel Broking Private Limited (hereinafter referred to as “Angel”) is a registered Member of National Stock Exchange of India
Limited,Bombay Stock Exchange Limited and Metropolitan Stock Exchange Limited. It is also registered as a Depository Participant with
CDSL and Portfolio Manager with SEBI. It also has registration with AMFI as a Mutual Fund Distributor. Angel Broking Private Limited is a
registered entity with SEBI for Research Analyst in terms of SEBI (Research Analyst) Regulations, 2014 vide registration number
INH000000164. Angel or its associates has not been debarred/ suspended by SEBI or any other regulatory authority for accessing
/dealing in securities Market. Angel or its associates/analyst has not received any compensation / managed or
co-managed public offering of securities of the company covered by Analyst during the past twelve months.
This document is solely for the personal information of the recipient, and must not be singularly used as the basis of any investment
decision. Nothing in this document should be construed as investment or financial advice. Each recipient of this document should make
such investigations as they deem necessary to arrive at an independent evaluation of an investment in the securities of the companies
referred to in this document (including the merits and risks involved), and should consult their own advisors to determine the merits and
risks of such an investment.
Reports based on technical and derivative analysis center on studying charts of a stock's price movement, outstanding positions and
trading volume, as opposed to focusing on a company's fundamentals and, as such, may not match with a report on a company's
fundamentals. Investors are advised to refer the Fundamental and Technical Research Reports available on our website to evaluate the
contrary view, if any.
The information in this document has been printed on the basis of publicly available information, internal data and other reliable
sources believed to be true, but we do not represent that it is accurate or complete and it should not be relied on as such, as this
document is for general guidance only. Angel Broking Pvt. Limited or any of its affiliates/ group companies shall not be in any way
responsible for any loss or damage that may arise to any person from any inadvertent error in the information contained in this report.
Angel Broking Pvt. Limited has not independently verified all the information contained within this document. Accordingly, we cannot
testify, nor make any representation or warranty, express or implied, to the accuracy, contents or data contained within this document.
While Angel Broking Pvt. Limited endeavors to update on a reasonable basis the information discussed in this material, there may be
regulatory, compliance, or other reasons that prevent us from doing so.
This document is being supplied to you solely for your information, and its contents, information or data may not be reproduced,
redistributed or passed on, directly or indirectly.
Neither Angel Broking Pvt. Limited, nor its directors, employees or affiliates shall be liable for any loss or damage that may arise from
or in connection with the use of this information.